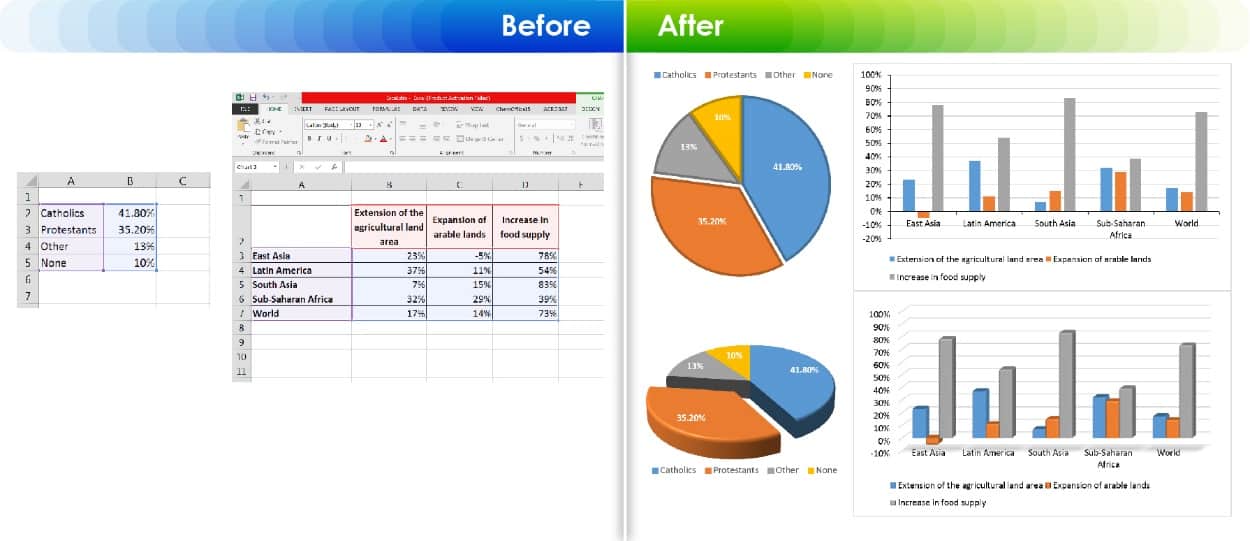
Do you need to convert your data into graphical plots? Allow our experienced figure experts do the work for you. We create illustrative graphs and charts in 2D or 3D effects from spread sheets or tabulated data.
Simply send us your raw data and we will:
- Check the graphical requirements of your target journal
- Professionally and accurately present your data
- Create publication-ready graphics
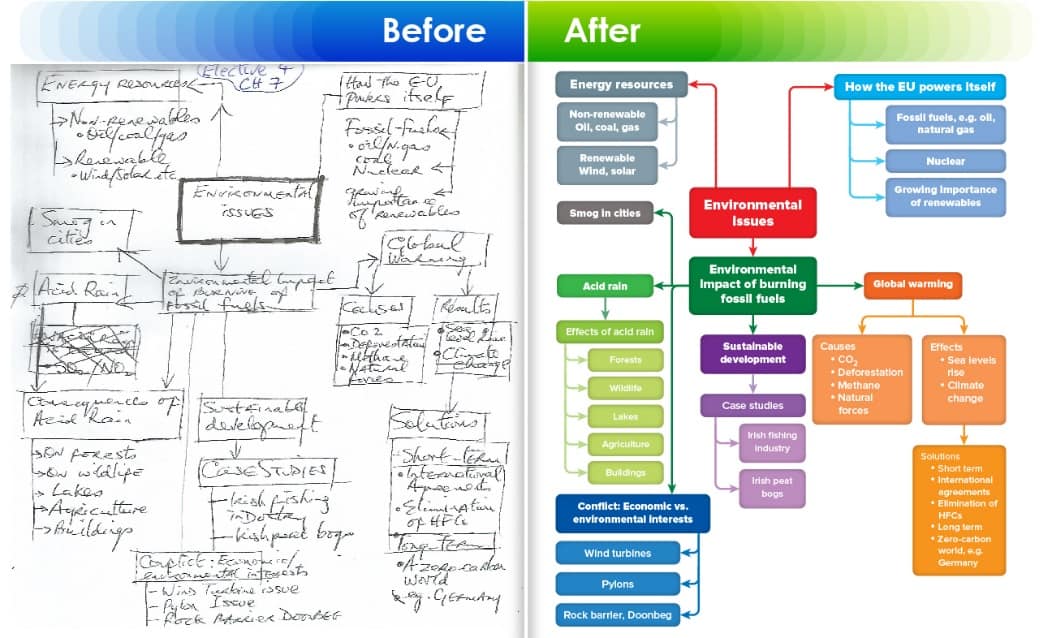
Render statistical, mathematical, chemical, etc. images from hand drawings
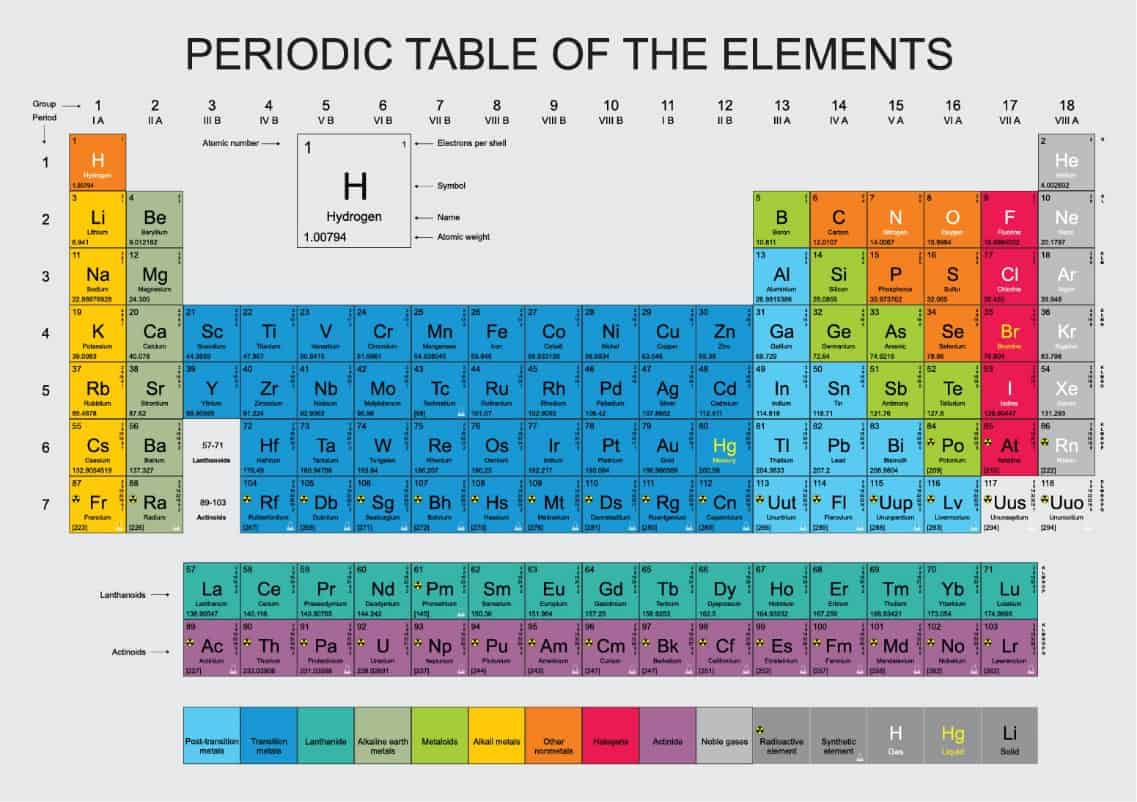
Create 2D and 3D figures based on Author requirements
Render high complex tables of any size as per client requirements